Overview
KoboBifrost Visualizer is a web application being developed using React and Tldraw to help visualize XLSForms as interactive flowcharts. This tool aims to address the challenges faced during XLSForm preparation.
History and Motivation
Everyone learns from mistakes, and like anyone else, I do too. While working as a consultant on a research project at CIMMYT, I was responsible for designing an XLSForm for a survey. The number of questions was large, and the rows in the XLSForm reached the thousands. With tight deadlines and all, I missed a constraint on one of the questionnaires, and it slipped through testing.
In production, I was notified by the enumerators, and I immediately pushed an update to fix it. This experience made me realize the need for a graphical solution to visualize the XLSForm during development, allowing me to catch such issues beforehand.
Staytuned
I have explored various solutions like Excalidraw, MxGraph, Graphviz, and Tldraw, and I am currently experimenting with Tldraw.
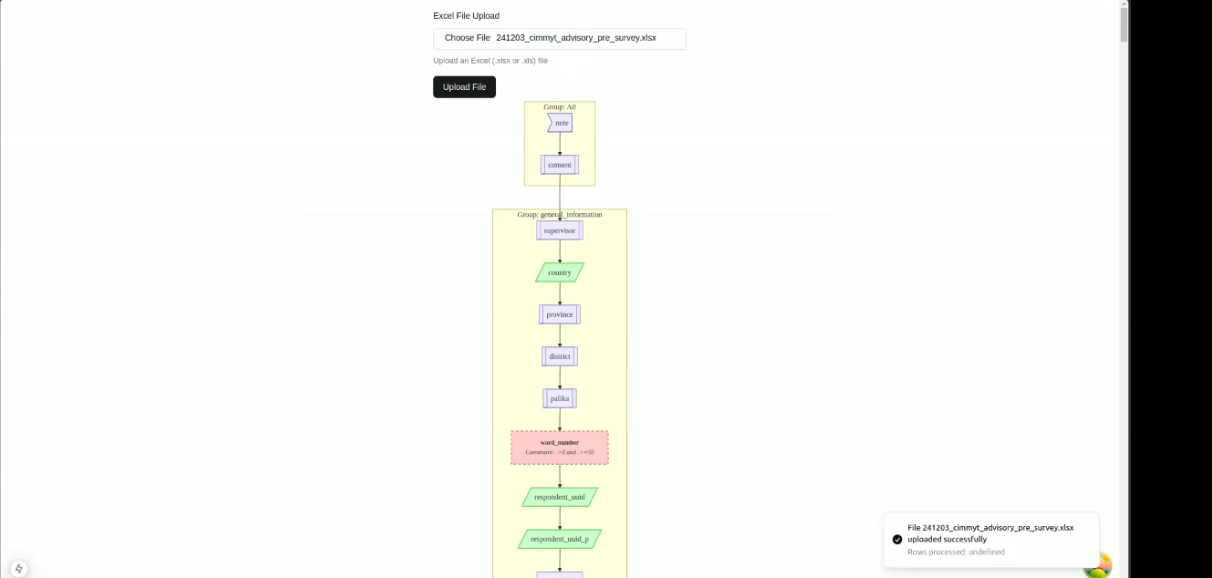
Here is a simple prototype flowchart I made using Graphviz and ReactJS. Since it lacked interactivity, I am now exploring Tldraw.
 Meanwhile, feel free to checkout other amazing project like KoboBifrost CLI and KoboBifrost Upload .